5 key points for the launch of a predictive maintenance project
Several modern or more traditional strategies may be envisaged for industrial equipment maintenance. When the equipment is fitted with sensors we refer to Industry 4.0.
The main maintenance strategies include:
- Preventive Maintenance, based on conservative hypotheses aimed at overprotecting the facilities according to a previously defined plan. It is interrelated with the true condition of the equipment. Even if preventive maintenance is relatively expensive, it helps ensure that almost nothing ever fails.
- Curative Maintenance waits for the equipment to fail before taking action. It may seem better value at first glance but does not consider all the collateral effects that unanticipated breakdowns can have (cost overruns, cascading effects, etc.).
- Conditional Maintenance is based on real time observations of industrial processes data. It triggers maintenance events when a threshold is reached beyond a particular unit.
- Predictive Maintenance takes advantage of historical data as well as any real-time data and helps predict when a piece of equipment is likely to fail. Components are changed when they need to be, which may lead to longer service life when their condition so allows or, on the contrary, it may trigger a maintenance event faster if the breakage is imminent.

At ENGIE Digital, we develop predictive maintenance products for a variety of industrial equipment. In this article we share the main points to be considered when launching such a project, we illustrate the challenges and present our responses through Robin Analytics, our combined-cycle gas turbine power plant (CCGT) digital solution. A solution that was rewarded at the 2020 Asset Performance Awards in the Asset Performance 4.0 category.
Maintenance strategies for this type of equipment may be envisioned as follows:
- Preventive maintenance for gas or steam turbines: this is very costly equipment whose start-up times are long, critical and whose unavailability stops any electricity production.
- Curative maintenance for certain sensors at the station: they are not directly involved in its control, or they are redundant or may be easily replaced.
Thus, for each type of equipment a specific strategy may be implemented, where conditional and predictive maintenance help optimise the replacement of equipment that is still operational, preventing unexpected failures and their implications.
1. Identification of the issue to be solved
Predictive maintenance may cater for many different uses. Here are the three cases that we use in our Robin Analytics solution:
- Estimate of remaining useful life of the equipment: this helps estimate the date of the next maintenance event based on actual equipment wear and tear; it helps prevent failures caused by early wear and tear of the equipment or increase its service life otherwise. This estimate also allows better planning of interruptions required for maintenance operations.
- Detection of anomalous behaviour: this helps identify imminent breakdowns and equipment shutdowns upstream, thus avoiding additional deterioration.
- Identification of the cause of anomalous behaviour/breakdowns: this directs maintenance operations towards the points that need to be investigated as a priority.
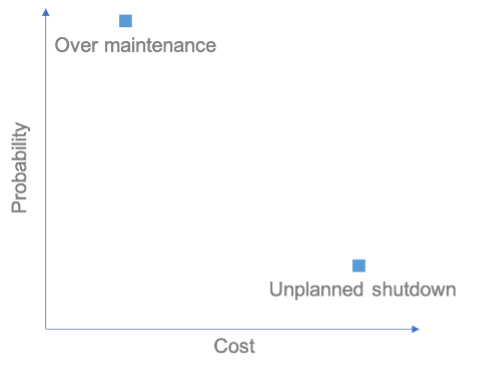
To prioritise the cases that must be dealt with, we have used a risk matrix. Thus, we have been able to assess the impact of any expected advantages and identify the equipment or parts of equipment on which we need to focus.
In terms of our thermal power stations, we have identified two bottlenecks:
1st point: unplanned stoppages
Where there is a breakdown or breakage of non-redundant equipment, the station is unable to keep producing. This has two highly tangible impacts:
- The energy that the station will not produce is a dead loss;
- The broken part may not be necessarily in stock, and delivery times may be too long (up to several months), thus delaying the start-up by the same amount of time;
- The breakage of a part while in operation may damage other components downstream.
Fortunately, such events are rare, but their cost is exorbitant. If a single event is prevented per year, the investment in predictive maintenance is recovered immediately.
2nd point: changing equipment that is still in good condition
Given its systematic nature, predictive maintenance sometimes imposes the renewal of equipment that is still in good condition. Monitoring such equipment and being aware of how much longer it can be used without risk helps reduce the cost of maintaining such equipment.
On the risk matrix, these two components appear as follows:
Once the use case has been identified clearly, it is time to ask the crucial question: what skills to mobilise?
2. Identification of experts and the skills required
By following a UX Design process to help identify the scope of our product, we identified three ‘Personas’:
- Maintenance experts. They are our main source of information; they are familiar with the mechanics of the facilities and are the users of our solution.
- Operators. They operate the equipment, do real-time monitoring, and know how to identify anomalies. They are also able to identify any data quality issues (for example non plotted sensor recalibration).
- Data scientists. They work with data to produce modelling capable of responding to identified instances and collaborate with field experts. To this end, they need to possess very good interpersonal skills and an appetite for disciplines associated with equipment maintenance, i.e., thermodynamics.
Mobilising sound expertise is an important factor for the success of the project, just as much as data quality, which we shall be dealing with next.
3. Assessing the quality of data
Data quality is the GO — NO GO of the project.
If data quality is too poor, the project will be unworkable. In fact, there is too high a risk of exhausting teams and of reaching a wobbly solution. It is then preferable to change the equipment or to launch an initiative to help improve the situation.
If this is the case, the data quality improvement process will attack the great classics of poor quality: outliers, missing data, physical limitations to be respected, etc.
The issue of data quality is crucial because data literally tell the story of the equipment. The following questions need to be asked:
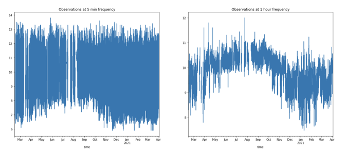
- Is there an explanation for time series jumps?

is a change of filter (source: ENGIE Digital)
- Are past maintenance dates known (i.e., traced, documented and retrievable)?
- Have past breakdowns been traced, i.e., labelled? With what additional information (type of failure, piece of equipment affected, etc.)?
- Do we have enough external information to clean up the data (for example the dates and impact of sensor recalibration)?
- Are the metadata we need available (the unit of each quantity, the exact location of the sensor, its condition, etc.)?
We also need to ensure, with the help of field experts, that all the sensors needed to recreate physical quantities required to describe the phenomena of interest (and which will be the features of the models) are present. Certain metrics identified by field experts provide immediate guidance on the condition of the equipment. For example, for thermal power stations, a separation from the benchmark curve for an indicator called a flow factor helps experts identify the amount of wear and tear of certain valves.
Furthermore, we need to bear in mind that the sensors, from which you get your precious data, will fail from time to time, particularly if there are many thousands of them! To this purpose, we set up a monitoring system: in a sense, it is the maintenance of predictive maintenance.
Data quality must follow extremely specific requirements. To ensure data quality, we need to review a certain number of monitoring points without which we cannot guarantee a clear and transparent reading of equipment related events.
4. Consider modelling options
By this stage, we have identified the question we want to answer. However, appropriate techniques to identify the answer will vary depending on a variety of parameters detailed below.
Firstly, is the phenomenon (e.g. failure) we are attempting to identify present in the data history? The answer to this question depends mostly on the maintenance strategy in place, because preventative actions deprive us of valuable data on breakages, anomalies or even of a few hours before the failure. In our case, equipment part breakage events were either absent or very seldom available in the data; it was therefore preferable to focus on modelling ‘normal operation’ and to alert the user when the measured data depart too much from the model. If the event had been sufficiently present in the data, we could have considered classification type approaches over a window of time and produced a failure probability.
Secondly, is it possible to estimate the features going forward? For our case, where we are estimating service life remaining, we need to make some predictions for the future. To this end, we had to develop certain hypotheses. For example, a piece of equipment may have an expected remaining useful life of 6 months in full time use but, if it is only used a few hours a week, its service life expectancy may be several years!
In the case of Robin Analytics, our equipment is degraded the most at times of numerous startups and stops of the power stations. Therefore, our hypotheses are based on the historical use over an equivalent period.
Thirdly, how detailed an explanation do the users need? Putting our trust in the outputs of an algorithm on our field of expertise does not come naturally, in particular where field observation goes against the recommendations provided by expertise.
To assist users in understanding the modelling results, we developed a few best practices:
- Opt for explicit models (linear regressions, logistic regressions, etc.) rather than ‘black box’ models such as neurone network types;
- Limit the number of features at the start of the model, so that they can all be reviewed in one look;
- Perform a feature engineering based on quantities known to the business, that translate its physical reality rather than letting the model work its way through a large number of input variables and identify links that will mean little to the user;
- Provide easy access to values at the start of the user model.
There is a wide range of modelling options. And we need to select the right one, depending on the phenomenon being studied, the capacity to estimate features going forward and the explanation detail expected.
5. Identify your learning history
To train the models, besides the classic pre-processing associated with data quality, we chose to select certain parts of the data history of our equipment. How we make this choice depends on the nature of the case and the envisaged solution.
However, certain points need to be considered in every case.
Firstly, is the equipment standard or stand-alone? If the equipment is standard, you can mix the history of all the equipment of the same type, and it is easier to retrieve a significant volume of data. In this sense, it must be noted that the possibility of using the same model for several pieces of equipment, including new equipment with no history, depends on this standardisation.
In our case, the equipment is similar though not identical, which is often the case for industrial assets in electricity power stations. Thus, we focused on standardising all measurements and on a minimum set and obligatory sensors. Although this requires a substantial amount of work, working on artificially standardised equipment has so many advantages that the decision is justified.
Secondly, is there a need to identify ‘operating modes’? Certain types of equipment behave very differently depending on whether they are operated full time, whether they are in the start-up phase or whether they are operating at minimum power. Vibration data particularly will depend quite significantly on this. In our case, we deleted the power station’s start-up and shutdown periods to produce the algorithms. To this end, we had to describe such periods programmatically to be able to identify them.
Thirdly, how do we isolate ‘normal operation’ periods? Some of our approaches were based on the fact that in modelling normal behaviour it is not the depth of history that matters as much as the certainty that the calibration has been done over appropriate periods. Such a period means that we are not already in a relatively advanced degradation of the equipment. It means also that no external phenomenon — such as maintenance for example — has an impact during that period.
Fourthly, what is the most relevant time pace? This decision depends on the phenomenon under study. To detect very slow phenomena, such as wear and tear, we aggregate our data in a daily matrix. This helps eliminate the noise associated with sensor accuracy. For faster phenomena, such as breakages, we prefer a very fine time matrix.
It is only after answering these questions that we are able to begin modelling work. But in fact, this is only the beginning! To get to a digital product in production, which manages thousands of models, such as Robin Analytics, we had to take other considerations into account, which were just as exciting. To mention only a few: industrialisation of pipelines and models, acquisition of real time data, the creation of cloud architecture, the design and implementation of the user interface, etc.
In conclusion, the five key points that we have just detailed remind us that predictive maintenance projects are complex affairs that respond to stringent requirements. Without a clearly defined instance, without precisely identified skills and without data quality, no project can or should be launched, lest we get lost in endless tunnels, wasting time and energy.
To find out more, please check the Robin Analytics case on the website of AWS, our cloud partner.
And of course, we are recruiting! Are you looking to design and deploy differential software solutions, bringing machine learning into production AND helping build a carbon neutral future? Don’t delay, join us: https://digital.engie.com/en/jobs!